Why, hello there!
Meet Binary PewPew Map, my latest, and currently only pet project! TL;DR here is the GitHub link
Since so many of us in the security community have overcome their skepticism of AI I decided to give it a shot as well. And, because my friend Gadi made me. In the nicest way possible. Thanks Gadi. I had this project sitting on the shelf for years, a project promising a lot of fun, with marginal value for security research. Turns out I had more pressing things to do the past.. 9 years than writing JavaScript. Enter Claude Code, and what perfect opportunity to see what it can do, so that I don’t have to.
The project is binary visualization, more specifically malware visualization. I wanted to be able to extract binary call graphs from malware and visualize them, using attributes such as function and string references, or function sizes. By far not a novel idea, and also something I had already worked on in the past. In 2016 I was working on call graph visualization with D3, with graphs extracted using radare2. A lot of fun, and I learned a lot, and I thought back then I’d keep working on this pet project, then life happened, etc etc. and here we are!
What does it do?
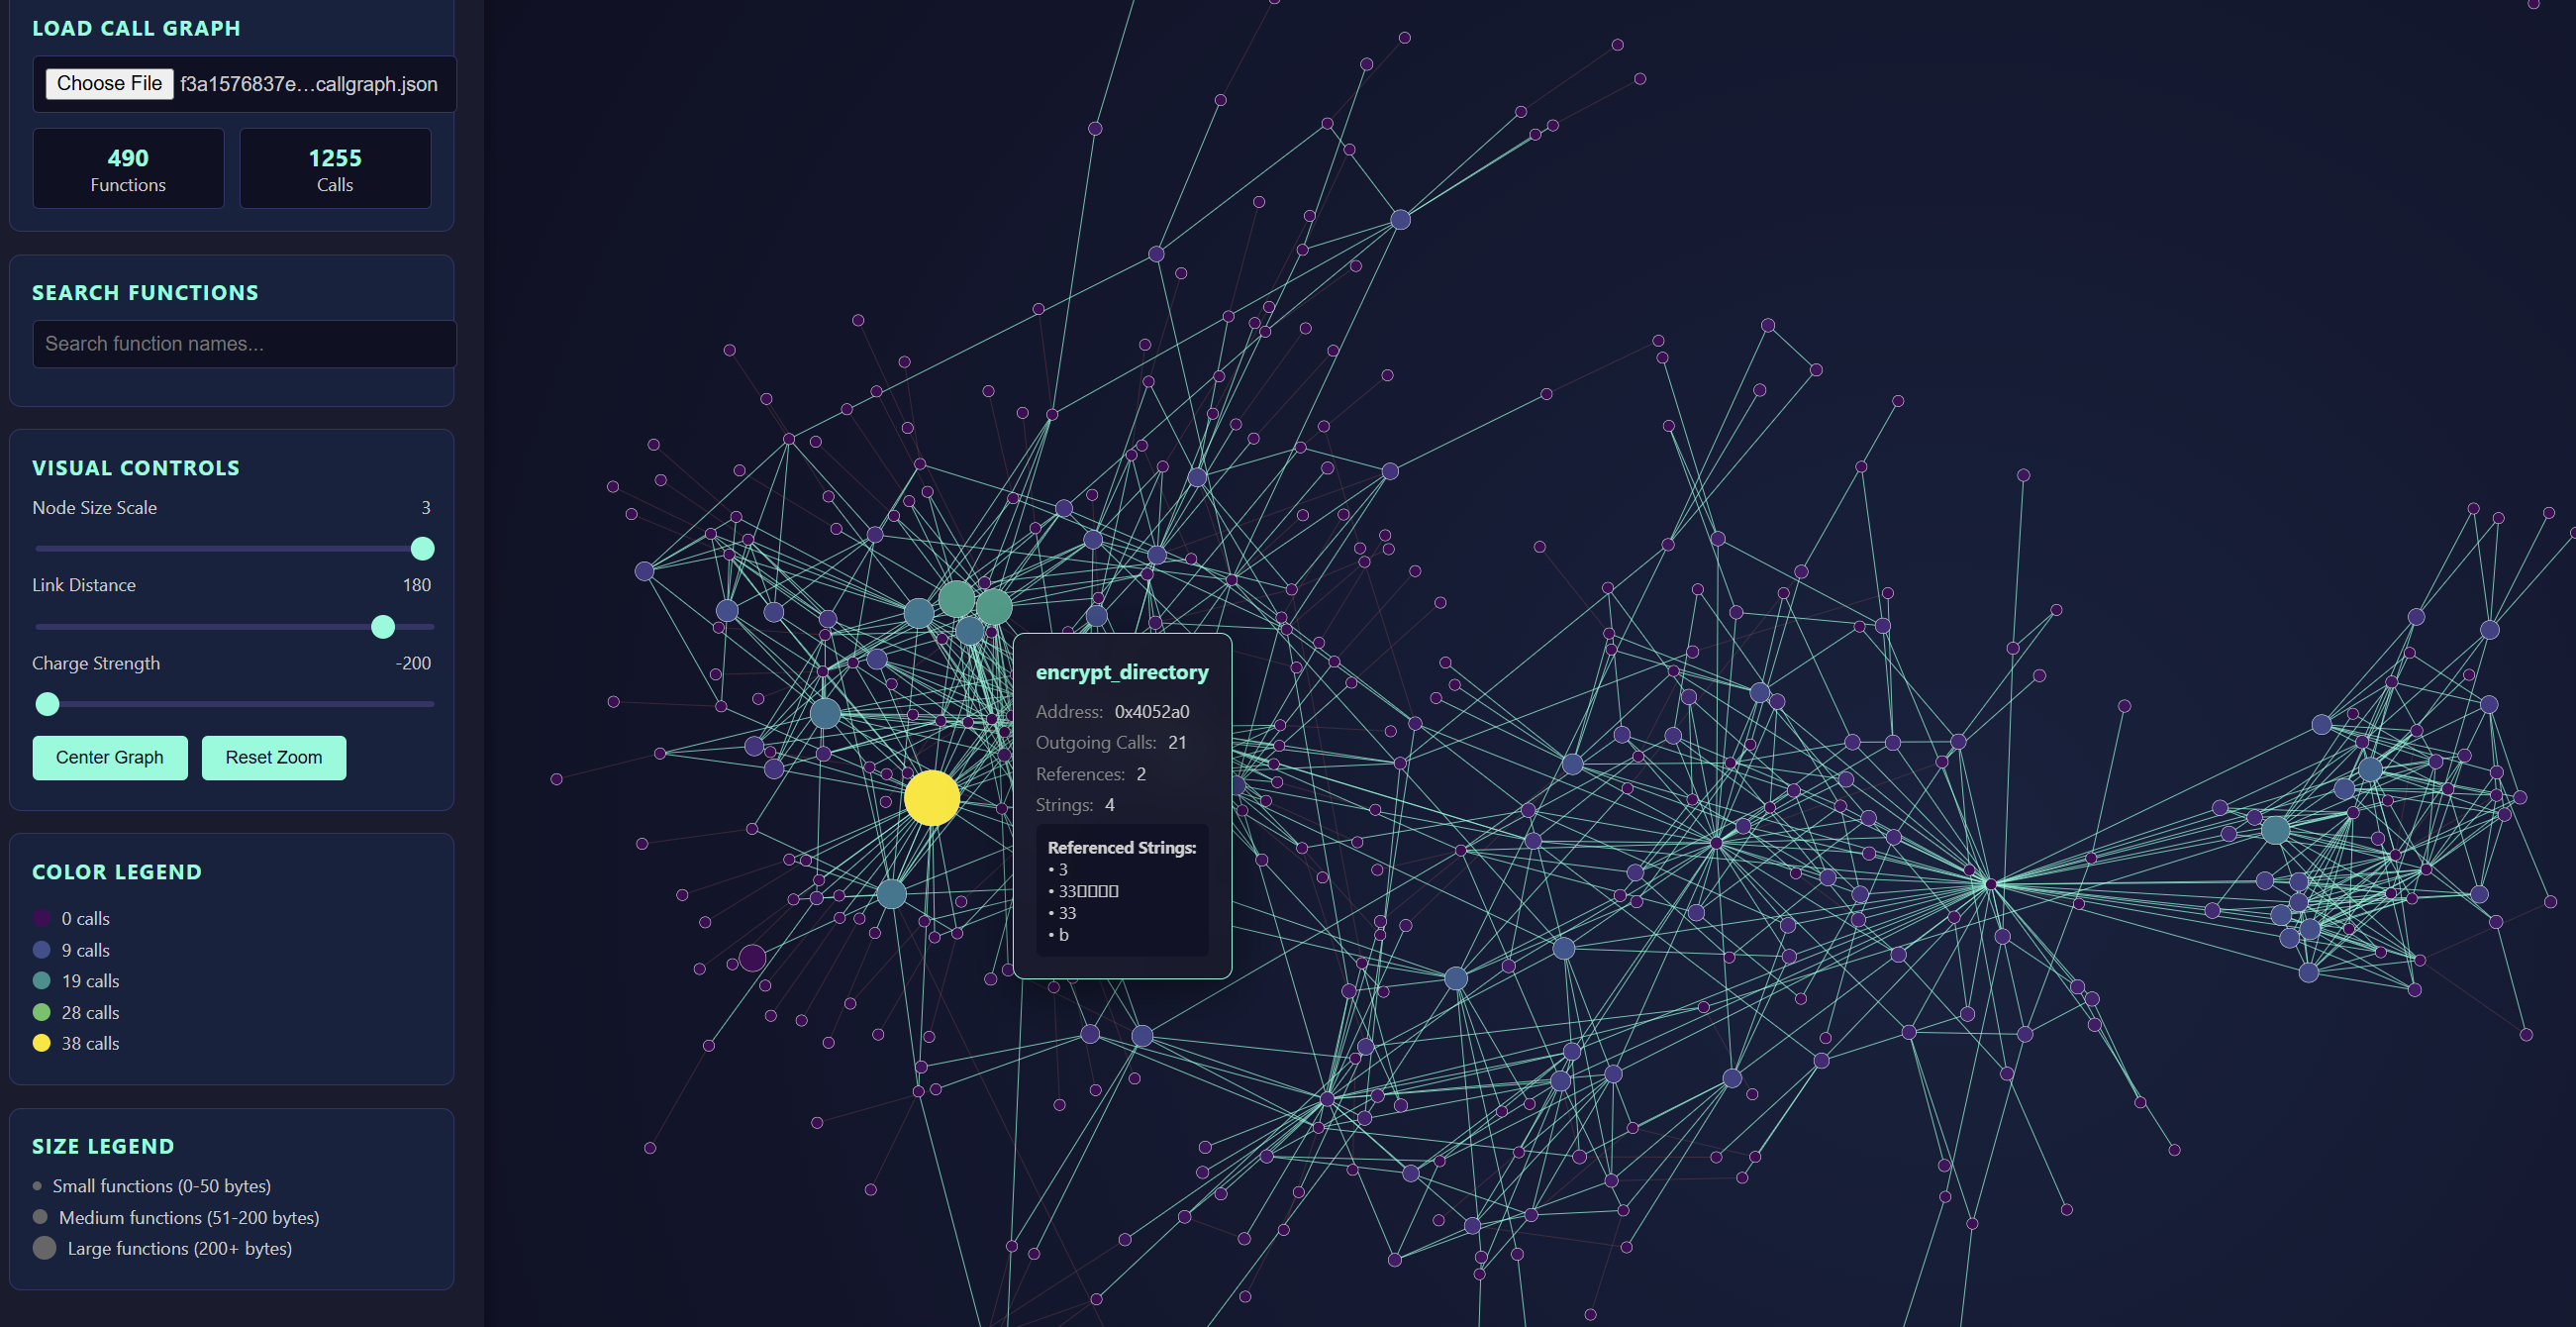
I have three scripts, one each for Ghidra, IDAPro, and Binary Ninja, and they all extract binary call graphs in the exact same JSON format, that can then be loaded into the D3 PewPew visualizer. That visualizer is a html page with a ton of unwieldy D3 javascript, which was all entirely generated by Claude. In fact, all the code was generated by Claude, with exception of the Ghidra graph extractor.
Anyway, what does all this do. The graph extractors iterate through functions and cross references of an executable and generate a graph where functions are nodes and function references are edges, this includes indirect references should the disassembly framework recognize the target of said reference. On top of that each function node knows of course the function name and address, the size, a list of referenced functions, a list of referenced strings, and the number of outgoing calls, references, and string references.
The scripts all run on Windows, probably on Linux too; for IDA and Binja one needs a pro license to be able to use the scripting API, graph extraction is optimized for Linux executables, although they parse Windows executables just as well cause graphs are graphs. And, I have verified the correctness of the graphs for neither, so, use with that in mind.
How?
Well so, I had the radare2 project, and was inspired to write a call graph extractor for Ghidra, hoping to eventually feed that to the same D3 visualization code I had successfully copied, pasted, and adapted a long time ago. As it turned out that did not work out of the box, and my JavaScript debugging skills leave a lot to be desired. So eventually I opened Claude, handed it a sample JSON graph, and asked in with great detail to generate me a D3 directed graph visualization for this JSON call graph, that would be interactive and adjustable, and provide info boxes with function attributes should one click on a node.
Claude generated the page, and out of the box, my Ghidra call graphs were visualized flawlessly. A shocker. I didn’t even need the infamous human in the loop. I was intrigued. So intrigued in fact that my next idea was to add pewpew sounds, which Claude promptly did as well.
But then, why stop here. I asked Claude to generate me scripts for call graph extraction for Binary Ninja and IDAPro as well. And so it did, but I noticed several things that did not work out of the box there. Bummer but ok, there I was, the human in the loop. For both frameworks Claude’s use of the API was wonky, using deprecated APIs or APIs that never existed, it did in one case what was supposed to be input validation without ever checking the return value, and there were discrepancies in the JSON formatting compared to the input sample. However, by and large, both extractor scripts and the visualization page can’t have been more than a few hours of fiddling, certainly much faster than what I could’ve achieved writing it myself. So am I a believer now? Well, yes, I’m just worried I’ll forget how to write code all together if this is the future.
What for?
Now when I said marginal value what I meant was there is only so much one can glean from a call graph, no matter how pretty it is. What do we see from these visualizations? We can tell whether we have a simple or a complex binary, whether we have symbols or not, whether we have readable or obfuscated strings. We can tell whether the code logic is concentrated in a few big nodes, or whether we see one or more somewhat disconnected subgraphs that are called very rarely from the main code base. And yes there is pewpew sounds when one clicks on a function node.
But this project need not end here. I have tried to come up with a spaghetti metric as I call it, and color nodes by the likelihood of them containing cryptographic algorithms. Spaghetti meaning lots of arithmetic instructions but very few branches. Ahem, naming is hard. But ransomware is calling, so. What has also crossed my mind is to highlight functions if they contain potentially corruptible library functions, such as strcpy, memcpy, or wcscpy. Or mind you, more intricate bug patterns that can be seen in assembly code. Speed up static binary review. Why just look at assembly, when Ghidra offers p-code, and Binary Ninja offers a whole stack of intermediate representations. The sky is the limit.
Anyhow, this is a short one, usage instructions are in the readme of the project, I give no guarantees for this code whatsoever. Enjoy and let me know what you do with it!